Ethereum has spent the last four weeks on a bullish footing as the buyers managed to shoot the price up from around $1,000. The bears were waiting around the overhead resistance at $1,800. They have prevented further price increases twice thus far, so is it time for the bulls to rest?
Analiza Tehnica
De: cenușiu
Graficul zilnic
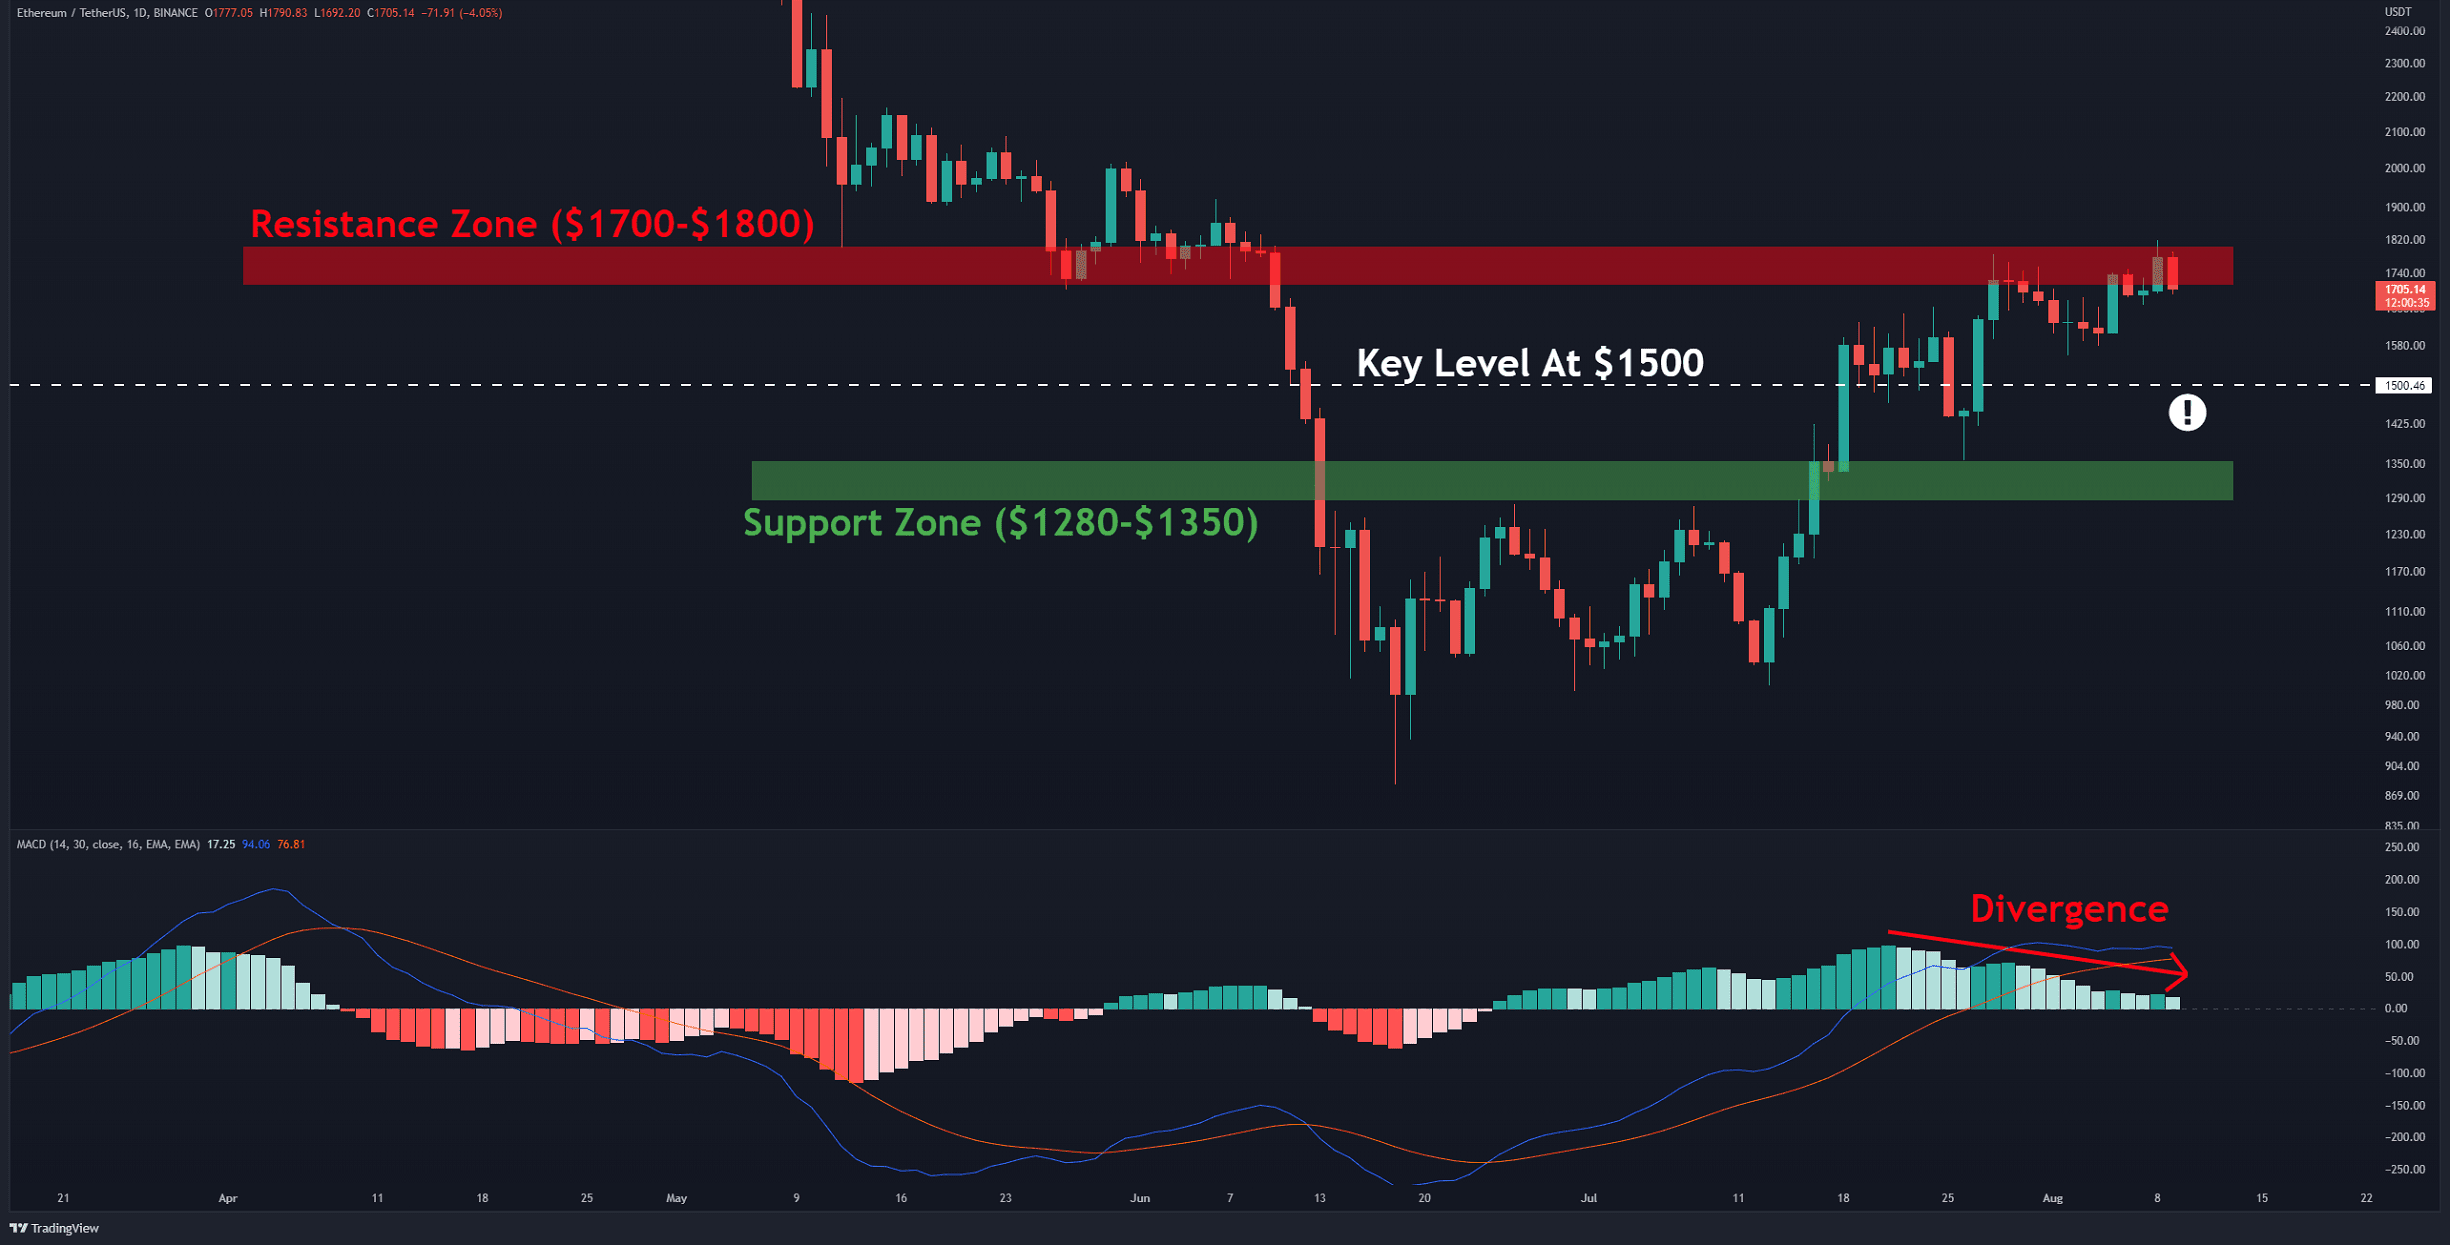
Yesterday, the bulls managed to briefly push the price above $1,800, but that’s where bears interfered. As a result, the cryptocurrency has fallen 6% as of this writing. The Moving Average Convergence Divergence (MACD) has shown negative divergence for some time, which is not good. Resuming the uptrend requires a break and close above the resistance zone at $1700-$1800 (in red).
On the other hand, if the bulls cannot clear this hurdle the bearish momentum may prompt the cryptocurrency to reach $1,500. A break below this level suggests that the bullish momentum has weakened. In this scenario, retesting the support zone in the range of $1,280-1,350 (in green) will look more likely.

Niveluri cheie de asistență: 1500 $ și 1350 $
Niveluri cheie de rezistență: 1800 $ și 2160 $
Medii mobile zilnice:
MA20: 1635 USD
MA50: 1374 USD
MA100: 1636 USD
MA200: 2269 USD
Graficul ETH/BTC
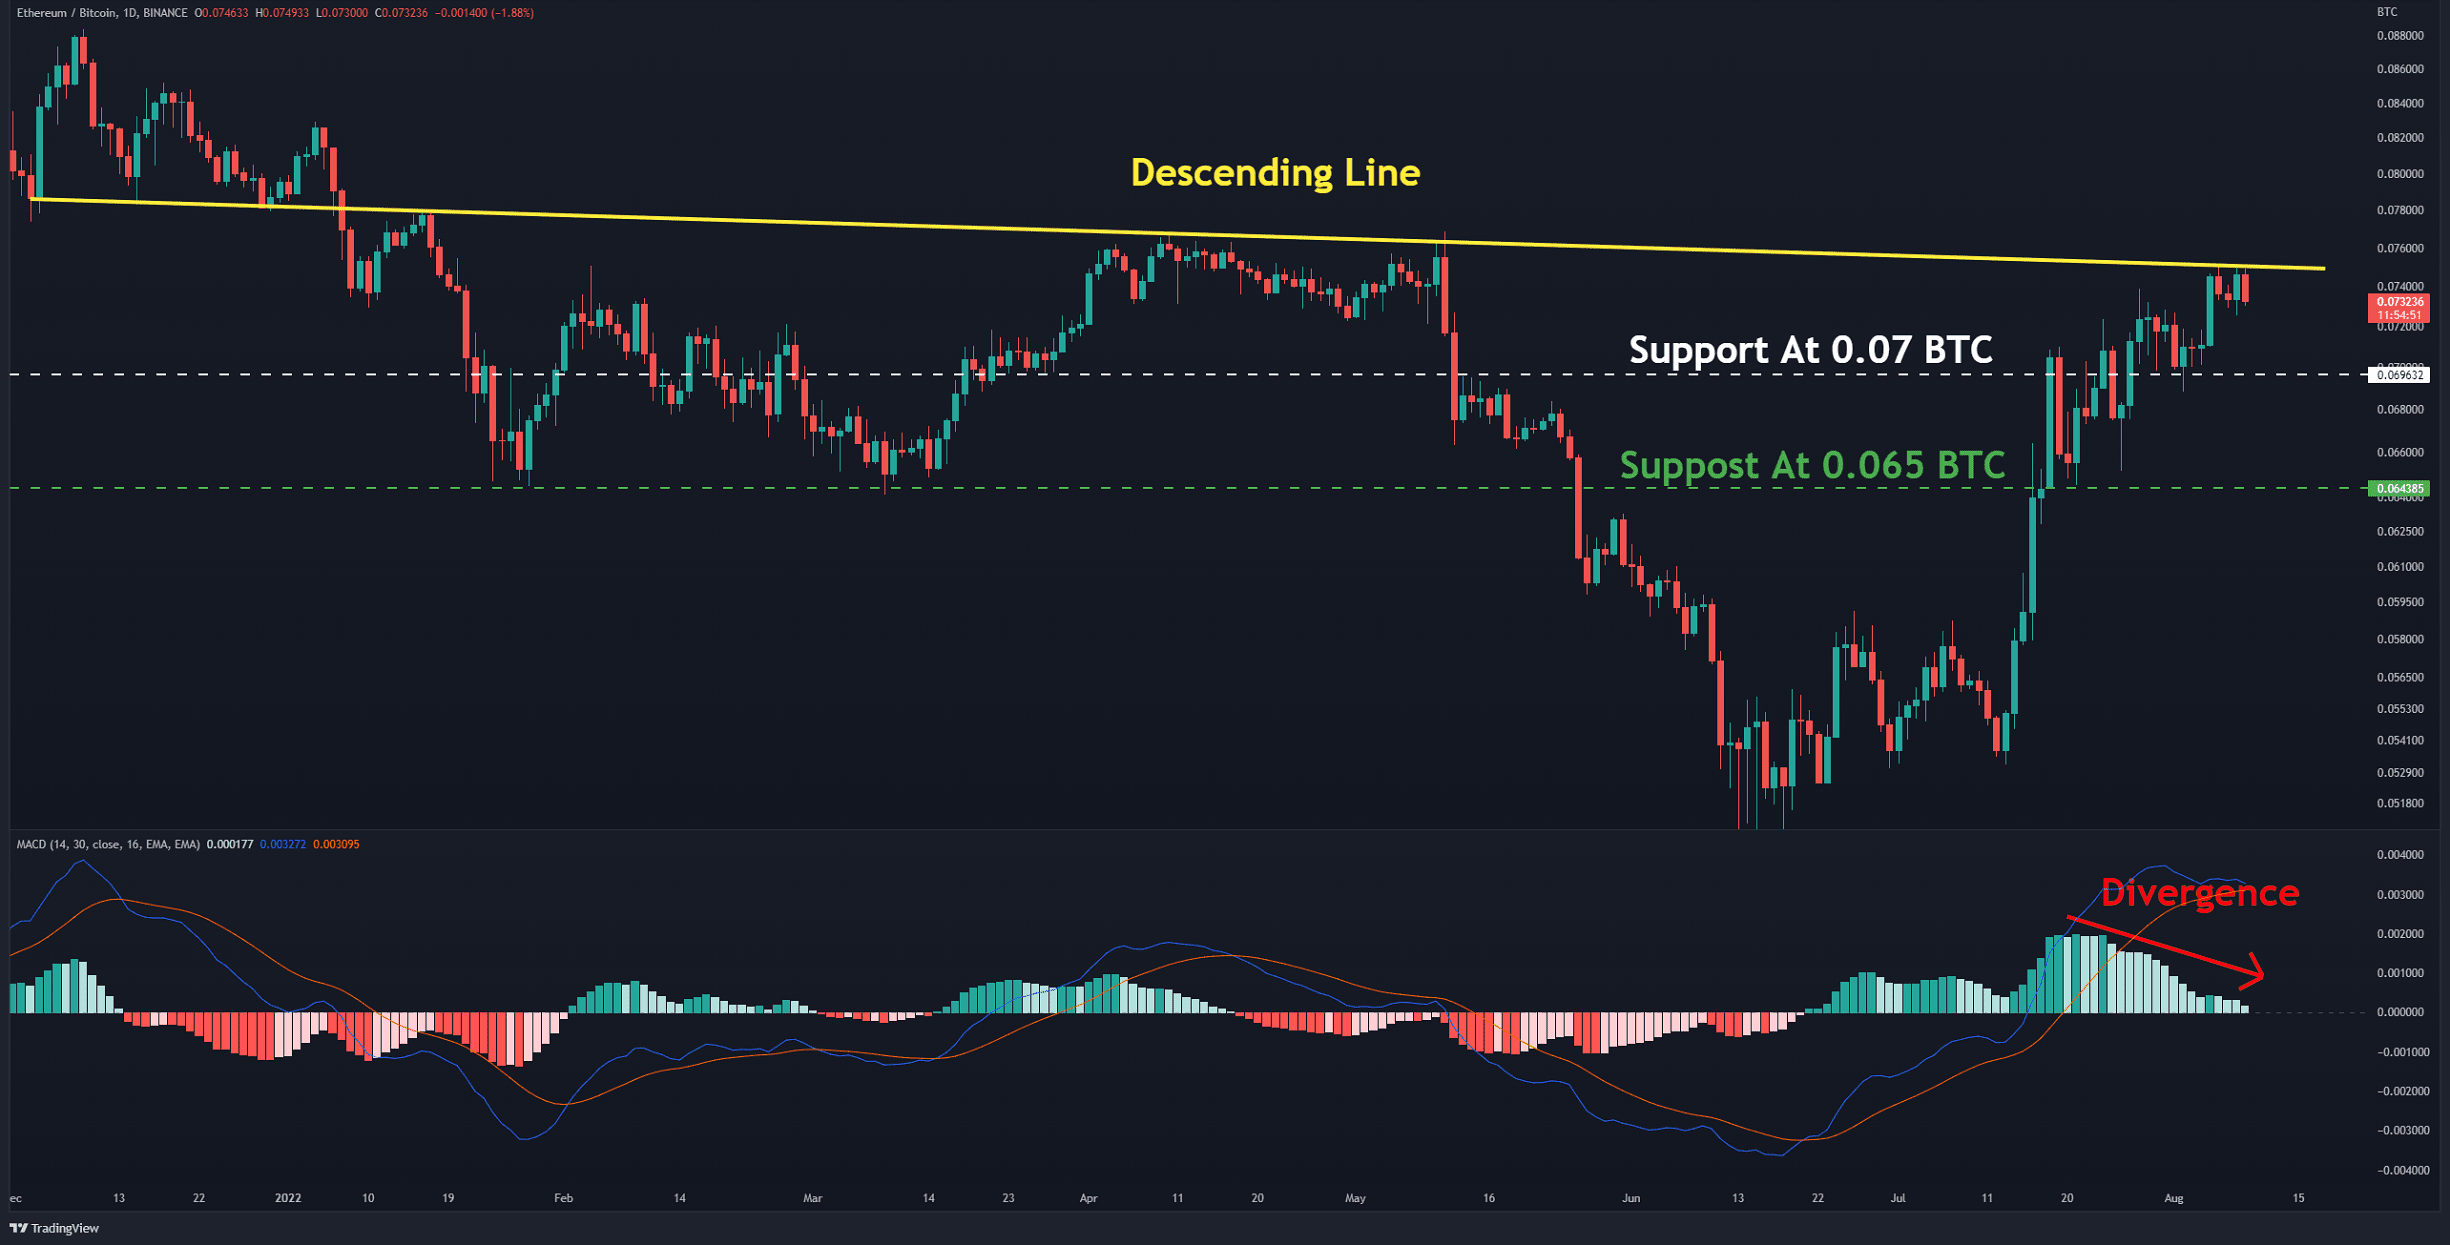
The bullish momentum against BTC seems to be waning. The divergence in the MACD indicator is clear. Bulls probably need to rest after breaking several firm resistances and reaching the descending line resistance (in yellow). The positive structure would remain strong as long as the bulls hold prices above 0.065 BTC (in green). If the horizontal support at 0.07 BTC (in white) cracks, the downtrend will likely be triggered. A close below 0.065 BTC signals the formation of a bearish structure.
Niveluri cheie de asistență: 0.07 și 0.065 BTC
Niveluri cheie de rezistență: 0.075 și 0.08 BTC
Analiza în lanț
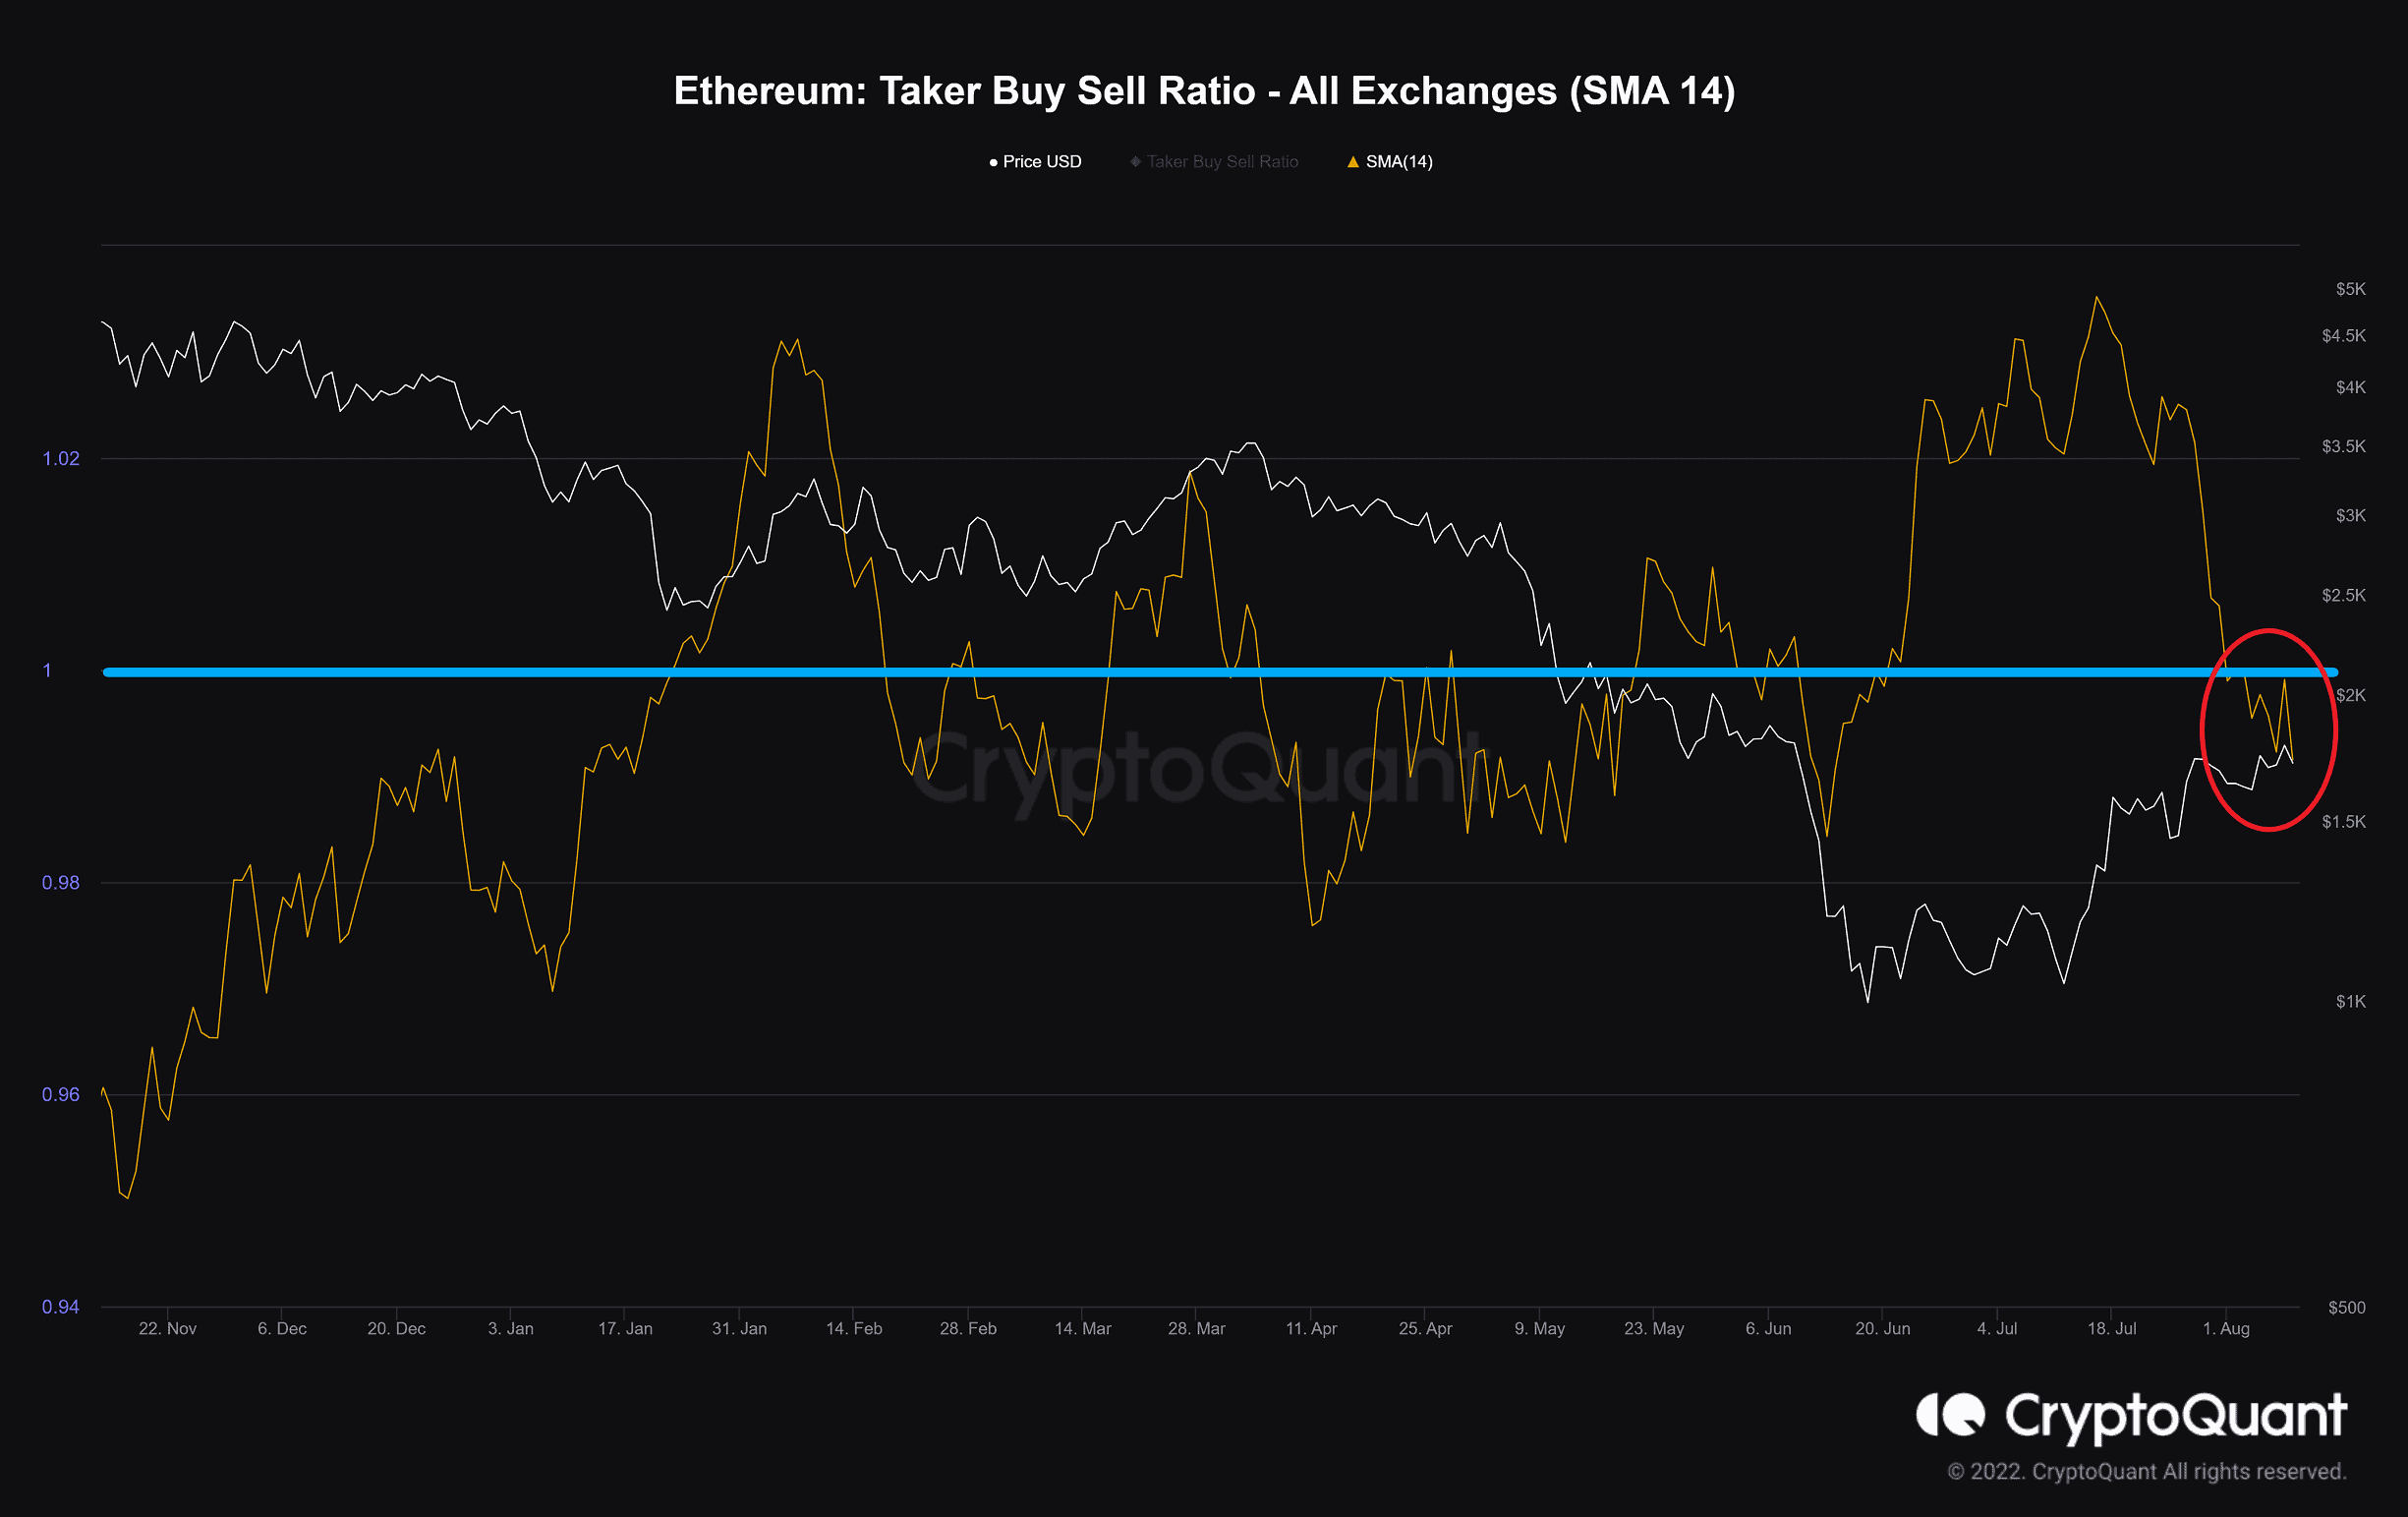
Taker Cumpărare Vânzare
Definiție: Raportul dintre volumul de cumpărare împărțit la volumul de vânzare al participanților la tranzacțiile swap perpetue.
Valorile peste 1 indică faptul că sentimentul optimist este dominant.
Valorile sub 1 indică faptul că sentimentul de urs este dominant.
According to CryptoQuant data, takers fill more sell orders in the derivatives market. This makes the bearish sentiment prevail for the time being. This metric ideally must stay below 1 (light blue line), so it’s important to remain very cautious.
Binance gratuit 100 USD (exclusiv): Utilizați acest link pentru a vă înregistra și a primi 100 USD gratuit și 10% reducere la taxe la Binance Futures prima lună (termeni).
Ofertă specială PrimeXBT: Utilizați acest link pentru a vă înregistra și introduce codul POTATO50 pentru a primi până la 7,000 USD din depozitele dvs.
Disclaimer: Informațiile găsite pe CryptoPotato sunt cele ale scriitorilor citați. Nu reprezintă părerile CryptoPotato despre cumpărarea, vânzarea sau deținerea unei investiții. Vi se recomandă să efectuați propriile cercetări înainte de a lua orice decizie de investiții. Folosiți informațiile furnizate pe propriul dvs. risc. Consultați Renunțarea pentru mai multe informații.
Graficele Cryptocurrency de către TradingView.
Source: https://cryptopotato.com/eth-corrects-6-overnight-after-failing-to-overcome-1-8k-ethereum-price-analysis/